S&P Global stands out as a premier infrastructure provider in global finance, delivering essential credit ratings, market data, and benchmarks that are deeply embedded in the operations of banks, asset managers, and corporations worldwide. The company’s business model is built on highly recurring revenues from ratings, data subscriptions, and index licensing, supported by strong pricing power and high customer retention. Its entrenched position is protected by regulatory requirements, a trusted brand, and massive switching costs, creating a durable competitive moat. Financially, S&P Global boasts industry-leading operating margins (around 40%), robust free cash flow, and consistent double-digit EPS growth. With the stock currently trading below its historical valuation averages, S&P Global offers investors a rare combination of stability, profitability, and long-term compounding potential—making it an attractive buy for those seeking exposure to the backbone of modern financial markets.
S&P Global: The Hidden Infrastructure Powering Modern Finance
What S&P Global Actually Does
S&P Global (SPGI) is one of the backbone companies of global finance. It provides credit ratings, market data, financial benchmarks (including the S&P 500), and analytics used by banks, asset managers, governments, and corporations around the world.
Whenever companies raise money, issue bonds, create investment products, or manage financial risk, S&P’s information and standards are involved. The company acts as a trusted source of “official” financial truth — measuring credit risk, defining benchmarks, and supplying structured data that professionals rely on.
SPGI earns money through ratings fees, recurring data subscriptions, and licensing fees from the many funds that track S&P indexes. These businesses benefit from long-term trends: more companies borrowing in capital markets, the rise of passive investing, and increasing demand for reliable financial data in a more regulated world.
In simple terms: S&P Global is a core infrastructure provider to the financial system, with sticky revenue, strong pricing power, and a reputation built over more than a century.
Why S&P Global Has an Unbreakable Moat
The company’s strategic importance stems from three core pillars. First, it operates within a credit ratings oligopoly. When governments and companies borrow in public markets, they need ratings from S&P and its two main peers. This isn’t optional — regulations and investor mandates require it. Second, S&P holds benchmark authority through indices like the S&P 500. Funds that track S&P indexes pay recurring fees. Third, S&P serves as a trusted data source that large banks, insurers, asset managers, and corporates rely on for risk models, regulatory reporting, and investment decisions.
What makes this position truly defensible is the unique combination of reputation, regulatory embeddedness, and scale. Credit opinions and benchmarks only matter if markets trust them, and in finance, credibility compounds slowly and rarely transfers. Banking and insurance rules formally reference S&P data and ratings, creating regulatory lock-in. The company possesses decades of clean, verified financial data that would be impossible to rebuild quickly. Institutions cannot easily re-platform risk systems or data feeds, creating massive switching costs. Network effects reinforce the moat further — issuers want S&P ratings because investors expect them.
This is the opposite of a startup-threatened industry. Even AI doesn’t break these moats easily. LLMs can summarize filings, but they can’t replace regulated ratings or audited data sources. Among its peers, S&P Global stands out as the most diversified player:
| Company | Core Focus | Edge |
| S&P Global | Ratings, benchmarks, data | Most diversified + biggest brand |
| Moody’s | Ratings + analytics | Strong franchise, slightly narrower |
| MSCI | Indices + ESG | Pure-play index powerhouse |
| ICE | Exchanges + clearing + data | Infrastructure + data vertically integrated |
The Revenue Engine: Built for Compounding
S&P Global’s revenue comes from three major streams that together create a powerful combination of recurring and activity-driven income. The Ratings segment generates fees when companies and governments borrow, issue bonds, or refinance. Subscriptions and Data Licensing brings in annual or multi-year contracts where clients pay for access to financial data, analytics, and workflow platforms. Finally, Index Licensing and Benchmark Services collects fees from funds and investors that track indexes like the S&P 500 or use benchmarks defined by S&P, plus payments for commodity and real-asset pricing data.
Over the past decade, this business model has delivered impressive growth. Revenue expanded from approximately $5.3 billion in 2015 to $14.2 billion in 2024, representing a compound annual growth rate of roughly 11%. The 2022 jump to $11.2 billion (up 35% from the prior year) reflects the transformative acquisition of IHS Markit, which significantly boosted scale and capabilities.
| Year | Revenue (USD billion) | Year-on-Year Growth |
| 2015 | ~5.3 | — |
| 2016 | ~5.6 | ~+6% |
| 2017 | ~6.3 | ~+12% |
| 2018 | ~6.9 | ~+9% |
| 2019 | ~7.0 | ~+2% |
| 2020 | ~7.4 | ~+6% |
| 2021 | ~8.3 | ~+12% |
| 2022 | ~11.2 | ~+35%* |
| 2023 | ~12.5 | ~+11% |
| 2024 | ~14.2 | ~+14% |
*2022 reflects the IHS Markit acquisition impact
This growth has been driven by several powerful tailwinds. Global debt and bond issuance creates more ratings opportunities. As financial institutions digitize their operations, they demand ever more structured data, analytics, APIs, and workflow tools, driving recurring subscription revenue. The relentless expansion of passive investing and ETFs means more funds using S&P indices and paying licensing fees.
Looking ahead to the next 12-24 months, the outlook remains solid. Management expects revenue growth of roughly 7-8%, which would push total revenue to approximately $15.2-$15.4 billion. Ratings volume should be supported if global capital markets remain active. The data and subscription business will likely continue mid-single-digit growth, supported by digital and AI transitions. Index and licensing should grow steadily as passive investing expands, with incremental opportunities in emerging markets and new product launches. Overall, the near-term growth environment is solid but not spectacular — this is a story about stability and consistency rather than breakout acceleration.
Exceptional Profitability That Rivals Software Companies
S&P Global is one of the most profitable companies in the global financial information sector. Its business mix — ratings, high-value data subscriptions, and index fees — supports software-like economics with strong pricing power and limited variable costs.
Operating margins have consistently remained in the 40-43% range over the past decade, an exceptional level compared to almost any data or financial services peer. The company started at 37% in 2015 and climbed to 43% by 2020. Margins dipped temporarily to 39% in 2022 due to integration costs related to the IHS Markit acquisition, then recovered to 40% in 2023 and 41% in 2024 as cost synergies were realized.
| Year | Operating Margin (Approx.) |
| 2015 | 37% |
| 2016 | 38% |
| 2017 | 40% |
| 2018 | 41% |
| 2019 | 42% |
| 2020 | 43% |
| 2021 | 42% |
| 2022 | 39% (IHS integration year) |
| 2023 | 40% |
| 2024 | 41% |
When compared to peers, S&P Global stands at the top tier:
| Company | Operating Margin | Comment |
| S&P Global | ~40–42% | Highest among diversified financial data firms |
| Moody’s | ~37–39% | Very strong, more concentrated in ratings |
| MSCI | ~55–58% | Higher due to pure index model |
| ICE | ~55% (exchange EBITDA) / ~40% OM | Mix of trading + data; strong but cyclical elements |
Looking forward over the next 12-24 months, management expects continued margin stability with mild expansion as restructuring costs roll off and technology integration efficiencies grow. Overall, profitability is expected to remain very strong and stable, with S&P maintaining one of the most attractive margin profiles in global information services.
EPS Growth: The Ultimate Scoreboard
EPS growth reflects recurring revenue expansion, margin discipline, buybacks, and selective acquisitions. SPGI has delivered consistent EPS growth over the last decade, with the only interruptions coming during major acquisitions and market slowdowns — but even then, the long-term trend remains firmly upward.
The numbers tell a compelling story. EPS grew from $4.49 in 2015 to an estimated $17.70 in 2024, representing a compound annual growth rate of roughly 14-15% — a strong result for a financial infrastructure provider.
| Year | EPS (USD) | Notes |
| 2015 | 4.49 | Steady subscription and ratings growth |
| 2016 | 5.20 | Ratings strong, cost discipline |
| 2017 | 5.78 | Healthy issuance environment |
| 2018 | 6.93 | Tax reform benefits + organic growth |
| 2019 | 9.21 | High issuance & strong index/data business |
| 2020 | 11.69 | COVID issuance surge boosted ratings |
| 2021 | 12.55 | Continued strength + pricing leverage |
| 2022 | 10.40 | IHS Markit integration, issuance slowdown |
| 2023 | 12.35 | Normalization + synergy realization |
| 2024E | ~17.7 | Boost from synergies + buybacks |
Compared to key peers, S&P Global sits in the top tier on consistency:
| Company | EPS Growth Profile | Notes |
| S&P Global (SPGI) | ~14–15% CAGR | Balanced mix of ratings + data; long runway |
| Moody’s (MCO) | ~13–14% CAGR | Similar ratings engine; smaller data footprint |
| MSCI | ~18–20% CAGR | Higher EPS growth; pure-index model, higher leverage to fee flows |
| ICE | ~10–12% CAGR | Mix of exchanges + clearing + data; more cyclical sensitivity |
Balance Sheet Strength and Cash Generation
S&P Global maintains a strong and conservative balance sheet. The company carries net debt at approximately 2.3 times EBITDA as of 2024.
What truly sets S&P Global apart is its exceptional free cash flow generation. This is a high-free-cash-flow business, thanks to its asset-light model and subscription revenue.
| Year | Free Cash Flow (USD B) | Comments |
| 2015 | ~1.6 | Strong cash conversion |
| 2017 | ~2.0 | Scale benefits + pricing power |
| 2019 | ~2.8 | Growth + high issuance cycle |
| 2021 | ~3.5 | Very strong issuance & index fees |
| 2022 | ~4.0 | IHS Markit integration, synergy build |
| 2023 | ~4.2 | Recurring data scale-up |
| 2024 | ~4.5+ | Continued synergy realization |
Shareholder Returns: Dividends and Buybacks
S&P Global returns capital to shareholders through a balanced approach of steady dividend growth combined with consistent buybacks. The current dividend yield sits around 0.8-1.0%.
On the buyback front, S&P Global is active and committed. The company resumed repurchases after completing the IHS Markit integration period, and management has authorization in place to continue using excess cash for buybacks
What Management Is Saying: Recent Guidance and Outlook
S&P Global’s most recent guidance, provided in their October 30, 2025 earnings call, points to continued steady operating performance across all business segments. Management reported improving global bond and loan issuance volumes, which directly supports the Ratings business.
The index and licensing revenues continue to benefit from the secular growth in passive assets, as more money flows into ETFs and index-tracking strategies.
On profitability, management reaffirmed that operating margins will remain around 40%, with the final phases of cost-synergy capture from the IHS Markit acquisition now in the tail stage. The company expects revenue growth of roughly 7-8% and EPS growth in the double-digit range, supported by operating leverage and share repurchases.
Management also reaffirmed the capital return policy, with ongoing buybacks and stable dividend increases funded by strong free cash flow On risks, management flagged the path of interest rates, the timing of issuance recovery, and potential corporate budget discipline around data workflow subscriptions as the main external factors to watch.
Overall, guidance points to continued mid-single-digit to high-single-digit revenue growth with strong profitability, supported by recurring revenue streams, cost discipline, and normalization in issuance activity. This is not a hockey-stick growth story — it’s a steady, predictable compounding machine.
Key Risks to Watch Over the Next 12-24 Months
While S&P Global’s business model is remarkably resilient, several risks could impact performance over the near term:
| Risk | Description |
| Slower pace of debt issuance recovery | Market caution or spread widening may pause refinancing, affecting Ratings revenue |
| Higher-for-longer interest rates | Delays pickup in capital markets activity and refinancing volumes |
| Corporate budget discipline | Financial institutions may delay data/workflow subscription upgrades |
| Competitive pressure at lower-tier data offerings | AI-enabled automation may increase alternatives for basic datasets |
| Final stage efficiency execution | Remaining post-IHS integration benefits may flow through slower as programs mature |
None of these risks fundamentally undermine the investment thesis, but they’re worth monitoring as they could create near-term volatility or moderate growth rates relative to the base case.
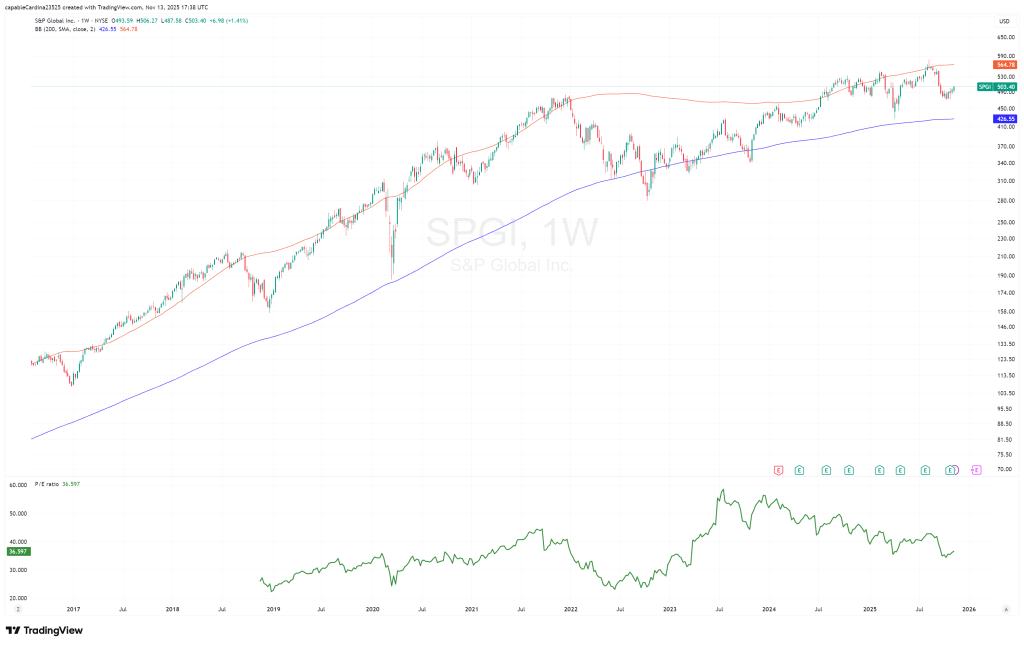
Valuation: Trading Below Its Own History
S&P Global trades at a premium to exchanges and diversified financial infrastructure peers, broadly in line with Moody’s, and below pure-index peers like MSCI. What’s particularly interesting is that the current valuation sits below the company’s own three- and five-year historical averages on forward metrics.
| Metric | Current (TTM) | Forward (NTM) | 3-yr avg | 5-yr avg | Comment |
| P/E | ~35–36× | ~24–25× | ~43× | ~39× | Currently below historical average forward multiples |
| EV/EBITDA | ~22× | n/a | ~25× | ~25× | Slightly below long-term average |
| EV/Sales | ~10.6–11× | n/a | ~11.5× | ~11.7× | Slight discount vs recent history |
This valuation context positions SPGI as a high-quality compounder priced below its recent historical norms.
Peer Comparison: How S&P Global Stacks Up
Business Mix Comparison
| Company | Core Focus | Revenue Mix Snapshot | Model Type |
| S&P Global (SPGI) | Ratings, financial data, indices | Balanced across Ratings, MI, Indices, Commodities | Recurring data + issuance exposure |
| Moody’s (MCO) | Ratings + analytics | Heavier on Ratings; smaller data arm | Highest correlation to credit cycle |
| MSCI | Indexes + analytics | Majority index-linked | Pure asset-linked fee model |
| ICE | Exchanges + clearing + data | Majority trading + clearing; growing data | Market infrastructure + data |
| LSEG | Data platform (Refinitiv), FX, indices | Data-heavy, less ratings | Data + trading + FX execution |
SPGI stands out as the most diversified data plus ratings franchise, giving it both cyclical exposure through ratings and defensive recurring revenue through subscriptions and indices.
Growth Comparison (5-Year CAGR)
| Metric | SPGI | MCO | MSCI | ICE | LSEG |
| Revenue CAGR | ~15% | ~9–10% | ~13–14% | ~6–7% | ~6–7% |
| EPS CAGR | ~13–15% | ~11–13% | ~18–20% | ~9–10% | ~7–8% |
S&P Global has achieved revenue CAGR of roughly 15% and EPS CAGR of 13-15%, making it the second-fastest grower in the group behind only MSCI.
Profitability Snapshot
| Metric | SPGI | MCO | MSCI | ICE | LSEG |
| Operating margin | ~40–42% | ~37–39% | ~55–58% | ~38–42% | ~30–32% |
Profitability is where S&P Global truly shines. Operating margins of 40-42% put it at the top tier, ahead of Moody’s and well above LSEG. Only MSCI operates at higher margins, but this reflects MSCI’s narrower business scope and smaller scale.
Competitive Advantages Summary
| Category | SPGI Advantage |
| Scale across ratings & data | Largest multi-pillar platform (ratings + data + indices) |
| Brand & trust | Global benchmark franchise across markets |
| Margin durability | Consistent 40%+ OPM, low volatility |
| Cash generation | High, stable, repeatable |
| Data breadth | Deepest cross-asset dataset outside Bloomberg |
Where others excel: MSCI achieves higher incremental margins through pure index economics. Moody’s has slightly cleaner credit beta exposure. ICE has a stronger transaction revenue engine through exchanges. LSEG offers more diversification into execution venues.
In summary, S&P Global offers the broadest business mix in the category — blending index economics, data subscription depth, and ratings leverage. It delivers best-in-class consistency, trades at a premium to exchanges but below pure index peers, and maintains superior diversification versus Moody’s.
Why Consider Buying: The Investment Catalysts
The investment case for S&P Global over the next 12-24 months rests on several identifiable business drivers and measurable external factors. These relate to capital markets normalization, operating leverage from scale, ongoing digitization of finance, and the maturation of the IHS Markit integration cycle.
Structural Drivers
| Driver | Description |
| Recurring data & index revenue base | High contracted subscription revenue and long-term index-linked fees |
| Mission-critical role in markets | Core position across ratings, financial data, benchmarks, and risk workflows |
| Industry consolidation & scale | Significant operational leverage and wide distribution footprint |
| Secular demand for structured financial data | Compliance, risk modeling, and institutional workflows continue to grow |
Cyclical / Medium-Term Drivers
| Driver | Description |
| Return of issuance activity | Gradual recovery in global debt issuance supports Ratings segment |
| Normalization of refinancing cycle | High maturity wall in corporate credit markets over 2025–2027 period |
| Stabilization in rate environment | Visibility on rate path supports capital markets confidence and AUM trends |
Company-Specific Catalysts
| Catalyst | Description |
| Final phase synergy capture | Remaining efficiencies from IHS Markit integration contribute to margin stability |
| Continued workflow product upgrades | Expansion in Market Intelligence functionality and integrated data sets |
| Index fee expansion | Growth in ETF assets tracking S&P indices and new index product introductions |
| Capital return continuity | Ongoing buybacks and dividend increases supported by strong cash generation |
Technology- and Data-Related Drivers
Integration of AI into research workflows is expected to enhance analyst productivity and client usage rather than substitute for core regulated datasets — S&P is embracing AI as an enhancement tool. And institutional and regulatory use cases increasingly require structured, verified, auditable datasets rather than unstructured alternatives, playing directly to S&P’s strengths.
Finally, macro and market enablers could provide near-term support. Decreased volatility in credit spreads supports issuance and refinancing activity. A stable or easing interest-rate environment improves corporate financing conditions. And healthy institutional asset flows support passive index-linked revenues.
Taken together, core monetization pillars are positioned to benefit from a more predictable macro backdrop, ongoing corporate refinancing activity, increased demand for regulated and structured data, and completion of integration-related efficiencies — all while consistently deploying free cash flow into shareholder returns and product investment.
This is not a bet on a growth explosion or a dramatic turnaround. It’s a bet on a high-quality infrastructure business continuing to compound value at double-digit rates, currently trading below its own historical valuation while multiple tailwinds converge.
Upcoming Events to Watch
| Approx. Timing | Event | Notes |
| Late Jan / Early Feb 2026 | Q4 2025 Earnings & Full-Year Results | Key read-out on 2025 issuance environment, FY cash generation, and updated 2026 guidance |
| Late Apr 2026 | Q1 2026 Earnings | First look at 2026 macro/issuance trends & subscription demand post-budget cycle |
| Late Jul / Early Aug 2026 | Q2 2026 Earnings | Mid-year checkpoint; updated commentary on credit markets and cost run-rate |
The Bottom Line
S&P Global operates at the core of global financial markets, supplying the ratings, benchmarks, and structured data that underpin capital formation and institutional investing. Over the past decade, the company has successfully expanded from a ratings-led franchise into a diversified financial-information platform, supported by recurring subscription revenues, index-linked economics, and global data infrastructure.
The business demonstrates high visibility and strong fundamentals. Revenue and earnings growth are supported by structural demand for financial data and market standards. Operating margins consistently run near 40%, among the highest in the industry. Free cash flow conversion is exceptional with minimal capital intensity. Net leverage sits at manageable levels around 2.3× EBITDA. And there’s an established track record of returning capital through dividends and buybacks.
The near-term operating outlook is shaped by several key factors: the pace of credit issuance recovery, stability in interest-rate expectations, and ongoing digital workflow adoption at financial institutions and corporates.
From a valuation perspective, the stock trades at a premium to exchanges and diversified financial platforms, reflecting its quality and consistency, but below pure-index peers like MSCI. More importantly, current valuation sits below the company’s own three- and five-year historical averages on forward metrics. Within the next 12-24 months, the environment for capital markets normalization, structured-data demand, and continued index adoption presents a steady backdrop for business performance.
Views expressed in “posts” (including social media) are those of the authors only. The posts are not directed to any investors or potential investors, and do not constitute an offer to sell — or a solicitation of an offer to buy — any securities, and may not be used or relied upon in evaluating the merits of any investment. No liability is accepted by the author, SLP Alpha for any loss or detriment experienced by any individual from any decision, whether consequent to, or in any way related to the content provided on the blog.
The contents in here should not be construed as or relied upon in any manner as investment, legal, tax, or other advice. You should consult your own advisers as to legal, business, tax, and other related matters concerning any investment. The value of stocks, shares and any dividend income may fall as well as rise and is not guaranteed, so you may get back less than you invested. You should not invest any money you cannot afford to lose, and you should not rely on any dividend income to meet your living expenses. Any projections, estimates, forecasts, targets, prospects and/or opinions expressed in these materials are subject to change without notice. Any charts provided here are for informational purposes only, and should not be relied upon when making any investment decision. Certain information contained in here has been obtained from third-party sources, and has not been independently verified.
Under no circumstances should any posts or other information provided on this blog be construed as an offer soliciting the purchase or sale of any security or interest in any pooled investment vehicle sponsored, discussed, or mentioned. Nor should it be construed as an offer to provide investment advisory services.

Leave a comment