With the closure of Strait of Hormuz one of the biggest global LNG suppliers – Qatar is blocked from delivering LNG cargoes. The blockade already significantly impacted prices for spot cargo deliveries in Europe and Asia. If the supplies won’t be re-established in the next several weeks, the elevated gas prices risk to affect economies of Europe, Asia and have significant effect on earnings of certain sectors. Below we try to understand the impact of the Qatari LNG cargoes blockade, look at the LNG market structure, at volumes and prices, seasonality in prices and supplies, analyse transmission mechanism from elevated European gas prices to electricity pricing and discuss winners and losers of the current supply disruption and why the situation may not be as precarious as it seems.
Structure of LNG Supply – The LNG market is around 412mt, predominantly supplied by five countries. Majority of the supply is under long term agreements up to 25-30 years with prices determined by a formula and sometimes linked to the oil price. Only around 36% of global supply is available for spot deliveries, majority of it coming from the US. The spot cargoes go to the highest bidder and these prices determine the marginal cost for importers. Qatar’s volume of around 80mt or 20% of global supply is under the risk of disruption.
| Country | 2024 Export volume, mt | Market share, % | % of spot / short term deliveries in the mix |
|---|---|---|---|
| US | 88 | 22 | 45-50 |
| Australia | 81 | 19.5 | 10-15 |
| Qatar | 78 | 19 | 15-20 |
| Russia | 33 | 8 | 20-25 |
| Malaysia | 26 | 6 | 10-15 |
Structure of LNG Demand – Similarly LNG imports are concentrated in a few countries, mainly in Europe and Asia with >60% of volume trading under long term contracts. For Europe Russian supply poses an additional risk, responsible for around 14% of supply and Putin publicly suggested stopping Europe exports (long term contracts with Russia should stop by 2027 anyway). For Japan, South Korea and Taiwan LNG supplies are structurally important even for securing baseload power generation, hence the highest share of long term contracts. China and India are more opportunistic and can be flexible in times of high spot prices. Europe became dependent on LNG supplies after stopping Russian pipeline deliveries and needs LNG to meet demand for the winter months.
| Country/Region | 2024 volume, mt | Global import share, % | Under long term contracts, % |
|---|---|---|---|
| Europe | 98 | 24 | 60 |
| China | 75 | 18 | 70 |
| Japan | 65 | 16 | 80 |
| South Korea | 46 | 11 | 80 |
| India | 25 | 6 | 60 |
| Taiwan | 20 | 5 | 75 |
Qatar LNG Customers – Qatar mainly supplies to Asian customers under long term contracts. European exposure remains limited. So far it exported 61.7mt, annualised 80mt
| Customer country | 2024 Volume, mtpa | Share in Qatari exports, % | Under long term contract, % |
|---|---|---|---|
| China | 18 | 23 | 95 |
| India | 11 | 14 | 90 |
| Taiwan | 8 | 10 | 95 |
| South Korea | 7 | 9 | 95 |
| Japan | 6 | 7 | 85 |
| Europe | 11 | 14 | 80 |
US LNG Customers – The US supplies Asian customers under long term contracts, but Europeans buy mainly on spot. It leaves Europe more sensitive and vulnerable to price spikes.
| Customer country | 2024 Volume, mtpa | Share in US exports, % | Share of long term contracts, % |
|---|---|---|---|
| Netherlands | 10 | 13 | <20 |
| France | 7 | 8 | <20 |
| Japan | 7 | 8 | 70 |
| South Korea | 7 | 8 | 70 |
| UK | 7 | 8 | <25 |
| India | 5 | 6 | 50 |
| China | 4 | 5 | 90 |
| Spain | 4 | 5 | 25 |
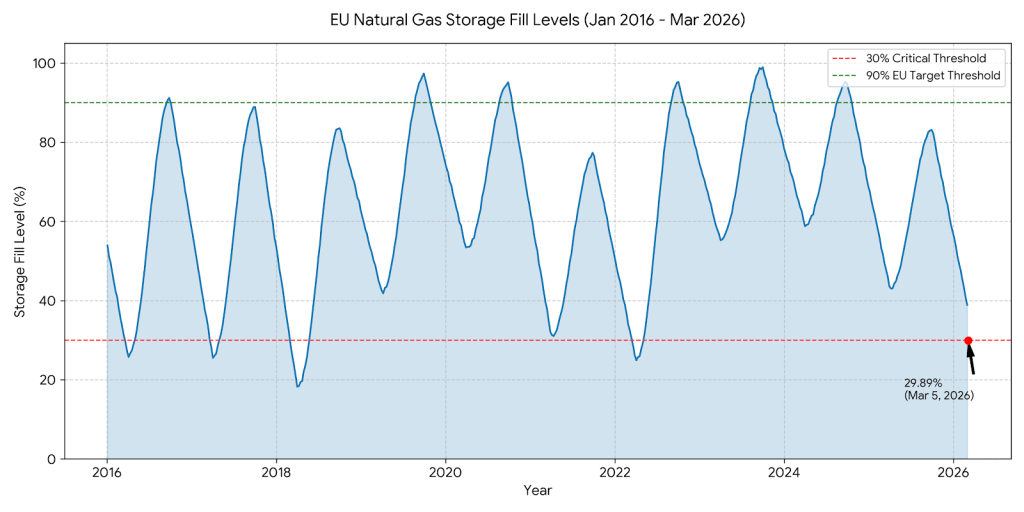
Is gas deficit likely in Europe – European gas storage system is filled at the level of 29% currently. The end of March is a seasonal low and by that time, assuming stable withdrawal rates, gas storage will be filled to 22 – 23%. This level is considered low and was seen at these levels during the Russian invasion crisis and in 2018 during the cold weather in early spring. While it is unlikely that Europe will face physical deficit of gas, the reliance on spot cargoes with potential longer-term blockade of Strait of Hormuz may result in elevated prices during storage refilling season in late spring summer.
| Country | Fill level, % |
|---|---|
| EU (Total) | 29 |
| Italy | 47 |
| Austria | 36 |
| Germany | 20 |
| France | 21 |
| Netherlands | 10 |
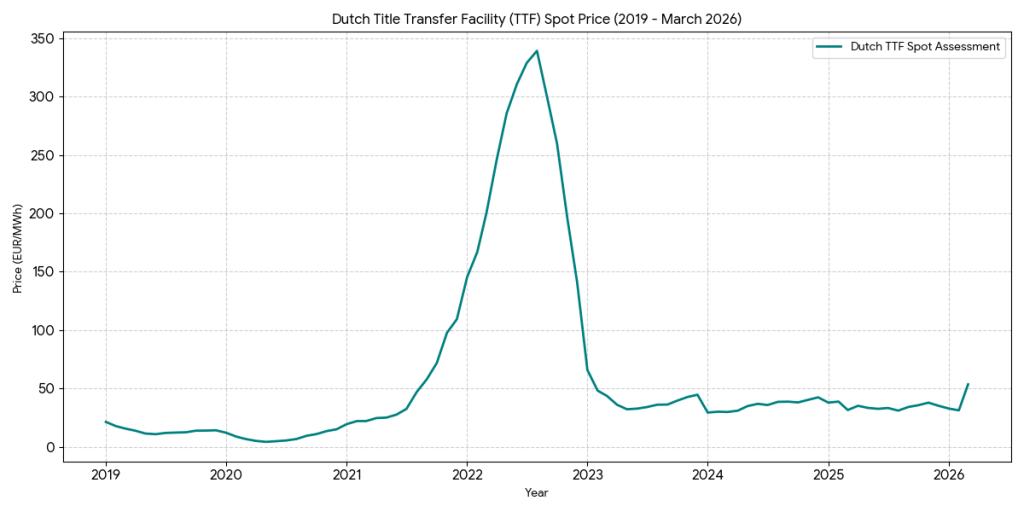
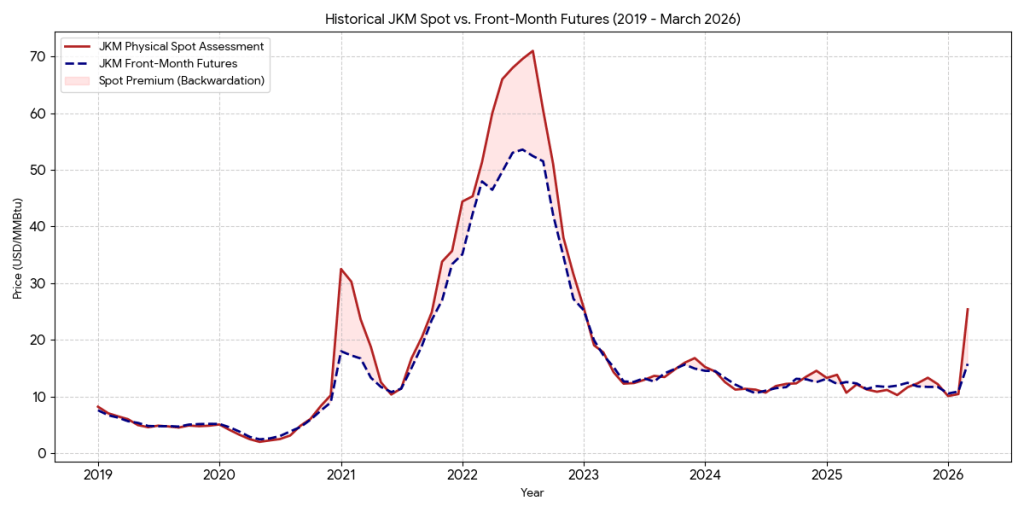
Gas Prices and Spot Premium – There are two main LNG spot gas price indexes. For Europe it is TTF, for Asia JKF. JKF consistently trades at a premium, reflecting tighter market and longer geographical distance (and so higher costs) from main swing producing region – US Gulf coast. Below are the TTF and JKM prices. Until 2021, European market was in surplus, relying on pipeline Russian supplies. However both seen a spike in February-March 2022, after Russian invasion and scramble for available LNG supply. Subsequent demand destruction and alternative supply sources led t market normalisation. Current Strait closure led to the highest gas price spike since the Russian invasion. It is also evident that spot cargoes trade at a premium to forward rate, which widens in times of supply stress.
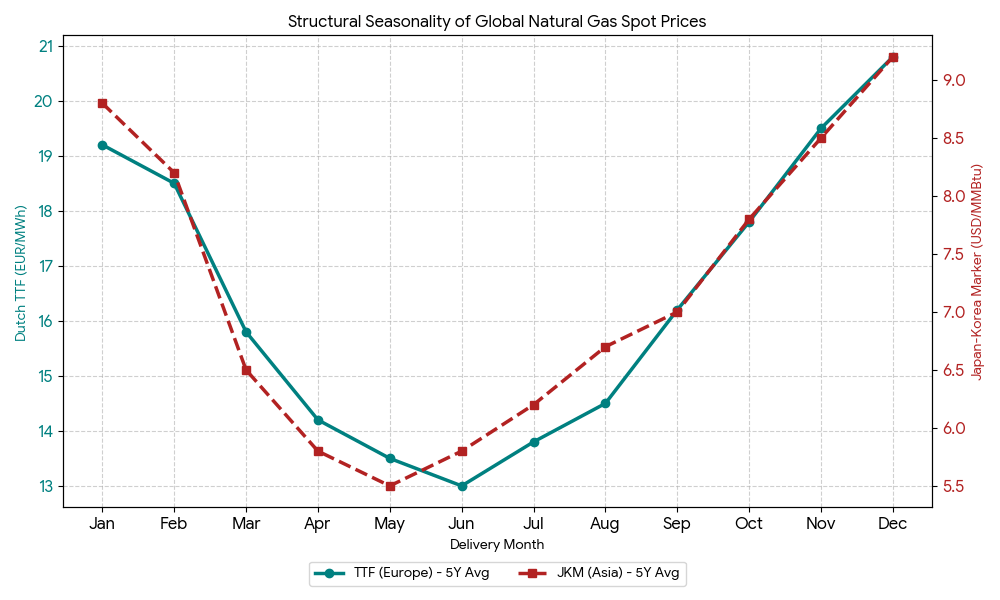
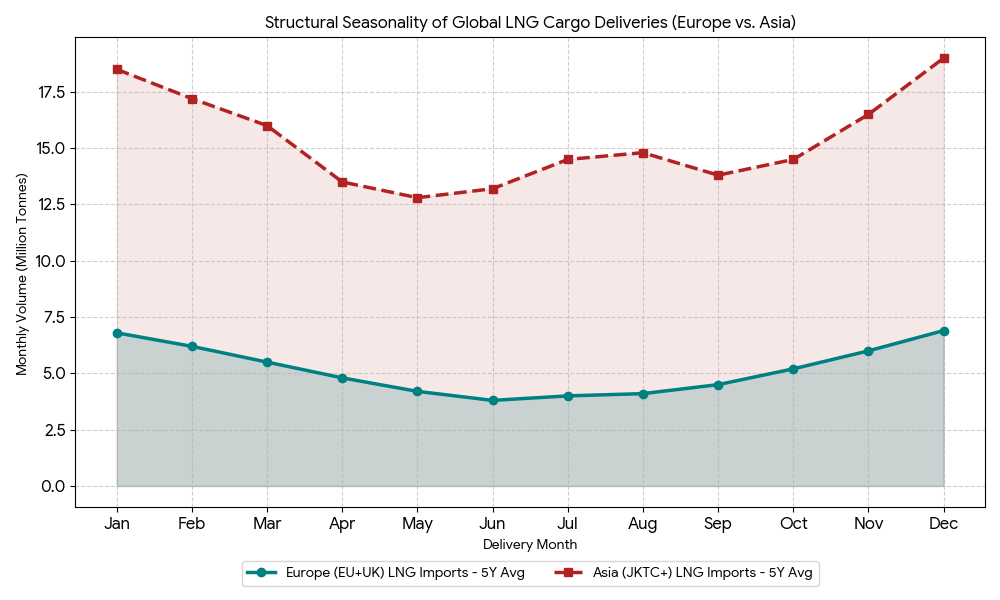
Seasonality of gas demand – gas demand is not spread evenly across the year. Europe as well as Asia experience demand spikes during winter months. In summer demand and prices get weaker. Supply is correlated with this pattern and there are more deliveries in winter months. European countries are obliged to build up reserves for the winter season. By 1st of December the storage volume should reach 75-90%. In normal years Europe fills its storage tanks by beginning of autumn, but effectively the time window is until winter. At the end of March Europe as well as Asia enter low demand season and the demand for gas will decline giving them timing flexibility to wait for the situation in Qatar to be resolved. This may be the reason that the gas prices and electricity prices showed relatively muted reaction and that at the signs of de-escalation in the Strait the market quickly normalises.
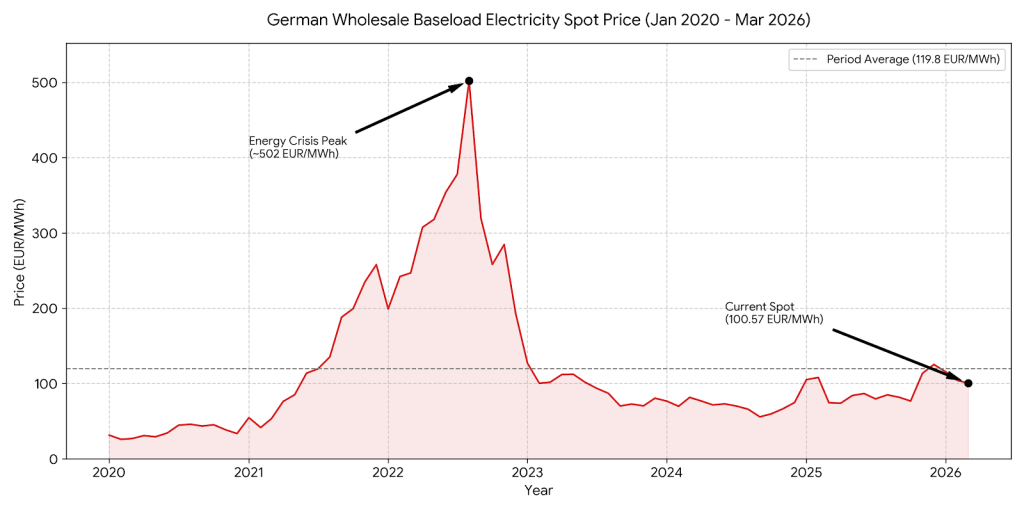
Gas price to electricity transmission mechanism – Utilities are natural beneficiaries of hikes in gas prices, if their fleet is on alternative fuel source and they sell some part of its electricity on spot. Gas fired power plants act as a marginal producer due to cost and ease of switching them on/off. Utilities in Germany consume 12-15% of aggregated domestic demand. So when gas spot prices jump, proportionally costs for utilities go up as well, which they pass through on to their clients. However this pass through is not 100% and is complicated by long term LNG contracts, that have their own price formula and forward selling of electricity on the part of the utilities. Therefore as can be seen below the spike in gas prices is not reflected yet in the German baseload price, which is also affected by increasing share of renewables (now 55% of total generation). and lower share of gas fired generation in the mix. It is interesting but the difference between peak- and base-loads collapsed in the recent years. The reason is the higher share of renewables, esp. solar, which is the most active during peak day times, operating with close to 0 marginal costs and outpricing gas fired generation. It is also worth keeping in mind that 70-80% of electricity generation output is sold on the forward market. With prices locked, the spikes in cost of production are reflected with a lag to the consumers.
Biggest consumers of Natural gas in Germany and most vulnerable industries – Consumers use gas both as a feedstock and as energy source. The sectors with biggest gas consumption are Chemicals (esp. ammonia production), Food and beverages, Basic Metals, Non-metallic mineral producers (glass, cement, ceramics), paper manufacturing, utilities. Especially vulnerable are companies with cost bases in Europe, producing commodity grade products, as they have to compete with producers with access to cheap gas or alternative fuels.
Sectors benefiting from the blockade of Qatari LNG cargoes
| Sector | Comment |
|---|---|
| Commodity traders and global oil companies | Buy cargo at a price linked to Henry Hub price and sell to the highest bidder. In times of stress arbitrage margins can be very significant. |
| Owners of LNG tankers | Tankers trapped in Persian gulf are temporarily out of market, and existing tankers redirected towards Asia for arbitrage reasons reduce tanker availability, pushing charter rates higher |
| European utilities | Those utilities that can capture increased spot prices, with stable cost generation fleet |
| Nitrogen fertilizers (ammonia, urea) producers | Gas is the main feedstock for nitrogen fertilizers. Gas price spikes in Europe Asia drive the prices for fertilizers highr. US producers rely on Henry Hub based prices, so experience direct margin expansion. |
| Alternative fuels for energy | When gas gets expensive, consumers try to substitute it with alternative sources or generators using alternative sources become more profitable and so get market share, at least temporarily, for example coal or mid-distillates. |
| Agricultural producers | Upward pressure for the agricultural products from increased nitrogen fertilizers prices. Lower yields in Europe and Asia due to lower application. Producers in Americas with lower cost fertilizers can outcompete both on volume and enjoy higher margins. |
