Recently several large asset managers – BlackRock, Blackstone and Blue Owl faced stress with their private credit funds. We try to understand what is happening in the industry, what became the trigger, try to assess the impact the situation could have on the asset managers and broader private credit market. We dive deep into risk metrics analysis and make conclusions if recent pullbacks in share prices of listed BDC’s made the valuation attractive to enter the sector. We look at why failure to convince OBDC II investors to merge with OBDC and continuous discount to NAV of OBDC is structurally important for Blue Owl equity story. We discuss the current structural weaknesses of public BDC’s and what needs to happen for the sector to become attractive once more for equity investors.
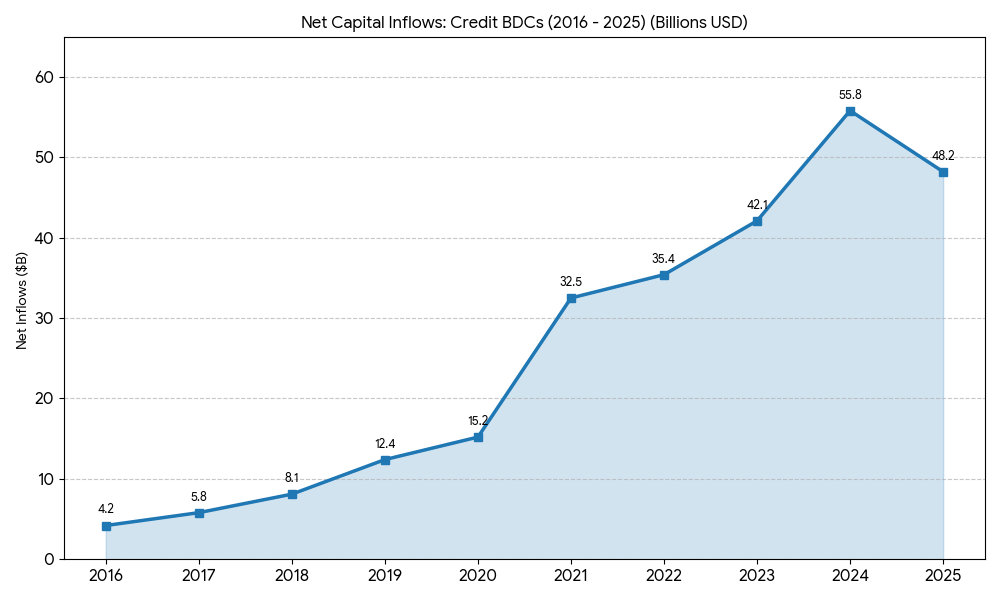
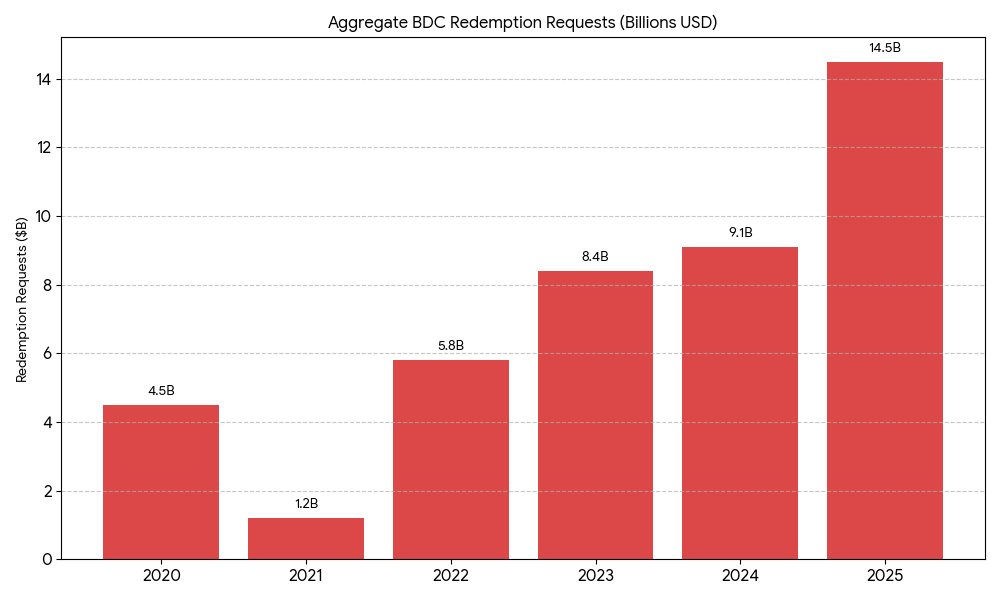
Summary – The private credit asset class enjoys strong inflows and is projected to reach several trillion by the end of the decade. It became the primary source of debt financing for LBOs. Recently several private credit funds (in the legal form of Business Development Companies or BDC’s) were responsible for negative headlines by receiving redemption requests over 5% quarterly limit. Valuations in the publicly listed BDC’s came under pressure and significant amount of BDC’s now trade at P/NAV below one.
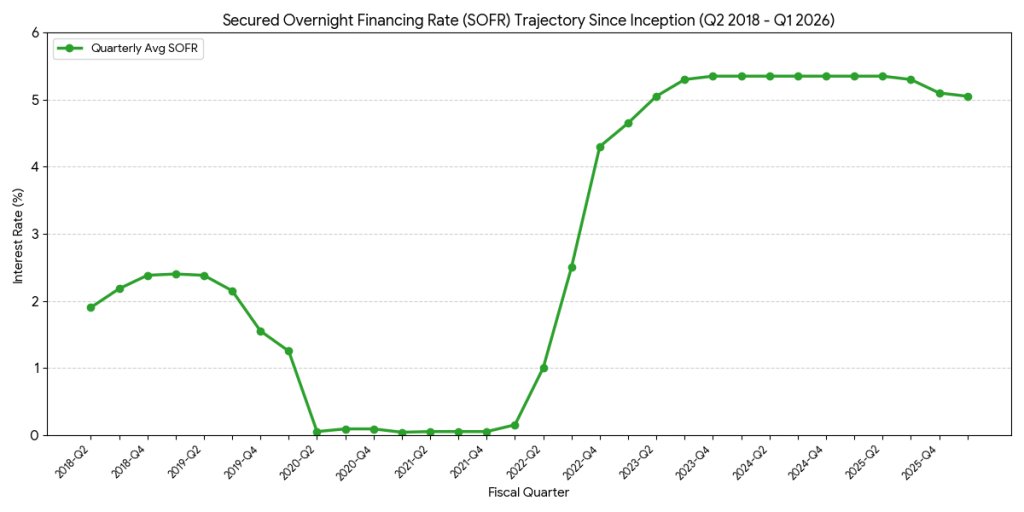
The redemption wave as well and underlying pressure in the sector come from increasing bad debt on the balance sheets of the funds. Bulk of this bad debt comes from 2020-2021 vintages, when interest rates were close to zero. As interest rates during 2022 substantially increased a lot of borrowers came under pressure. We look at bad loans indicators such as non-accrual loans (equivalent to NPLs in banks) and PIK (Payment-in-Kind recognition of loan interest) and find that those metrics are increasing and most likely will increase further during 2026.
We find that public BDC’s face increasing challenge to fund obligatory 90% dividend pay-out, meaning that some restructuring of distressed loan portfolios is necessary. We find, that BDC’s show increasingly higher share of preferred equity in portfolios which increases overall risk coming from equity exposure.
We look at the composition of distressed loans and LBO defaults and find that the bulk of them originate in Healthcare and Software sectors and these two sectors dominate the composition of PIK interest. Further challenge is the persistent discount of P/NAV of some BDC’s, limiting their ability to raise primary equity and grow, which ultimately becomes problem for shareholders and for the parent alternative asset managers, especially as the importance of private credit for their earnings increased quite substantially in recent years.
Overall the conclusion is, that public BDC’s will face further pressure in 2026 and possible in 2027, they need to address the issue with the bad loans on their balance sheets and show to investors the way to return to P/NAV above 1 and profitable AuM growth.
The main indicator to watch is stabilisation and reversal of share of PIK interest in the portfolio. If it will be apparent that BDC’s are dealing with legacy bad loans and grow the share of loans under current high interest rates there could be rationale for valuations, earnings and share prices to improve. However as of 4Q25 such improvements are not visible in the results.
In this analysis we focused on publicly traded BDC’s. But private BDC’s are not immune to the same structural issues. For an investor in private credit and in private BDC’s it is important to understand the extent of legacy bad loans (high and rising PIK interest) on the balance sheets and the resulting potential for NAV reduction by valuation committees. For an investor it is crucial to understand that there is no free lunch and the extra yield of private credit comes with increased risk resulting from illiquidity and reduced transparency.
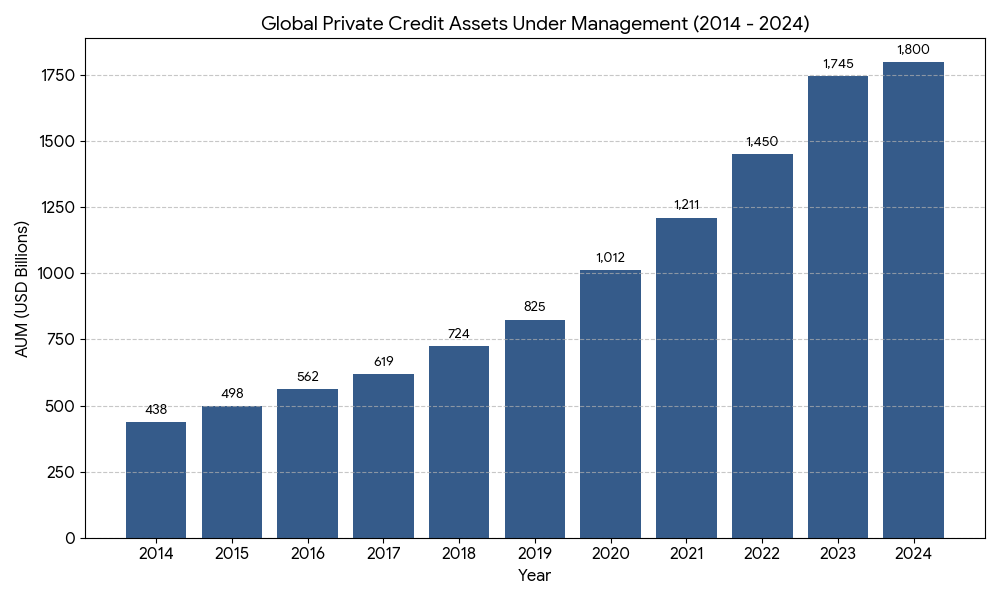
Private Credit Growth – In the last decade private credit funds have enjoyed high growth rate, taking market share from traditional banks and substituting syndicated loans. This trend was catalysed by increased regulatory pressure on the commercial banks to reduce exposure to the riskier parts of the lending market and optimise capital allocation in light of risk weighted assets approach. Private credit became especially prominent in the LBO market, replacing traditional syndicated loans.
Private credit fund structure – In the US the common vehicle for the private credit funds is Business Development Company (BDC), which gives certain tax advantages. BDC’s can be private and public, with finite life or permanent structures. Traditional BDC is a close end fund with a life of 5-7 years, sold to institutional investors and with capital locked for the life of the fund.
Public BDC’s have certain advantages to the management company and investors: 1. Provision of liquidity to investors, who can sell their shares on the exchange at any time. 2. Lower cost of capital for the fund, as it is more strictly regulated by SEC, driving capital costs down compared to private peers 3. Management companies do not have to close the fund and expose themselves to risks of capital raising cycles, but can utilise existing structure 4. Though listing and SEC oversight increases some costs, other costs are reduced by absence of constant opening and closing the funds. 5. Public BDCs are retail investors friendly, potentially making them easier to scale and charge management fees on larger asset base.
Current industry stress – The stress in the private credit ecosystem became apparent when a proposed merger between Blue Owl OBDC II private fund and publicly traded OBDC was rejected by shareholders of OBDC II.
Since then, two more prominent funds Blackstone Private Credit Fund, which is non-traded BDC faced redemption of 7.9%, above 5% quarterly limit and Blackrock HPS Corporate Lending Fund, also got redemption requests representing 9.3% of NAV deciding to gate redemptions at 5%. It is not normal for a fund to restrict redemptions and especially it is a sign of stress when several prominent providers do it simultaneously.
Historically it happened only during severe external shocks like COVID lockdowns in 2020; or when sharp interest rate increase during 2022 forced Blackstone to gate its non-traded REIT fund; or in 2015 when AR Capital faced an accounting scandal and was suspended from raising capital. Redemption restrictions are a heavy blow to the reputation of the managers and can negatively affect capital raising and accelerate redemptions from other funds.
Blue Owl Problem – Blue Owl (BO) is a publicly traded alternative asset manager focused on direct lending and real estate with total AUM of $307bn. In November 2025 BO tried to create liquidity event for the investors in the non-traded OBDC II fund by merging it with its publicly traded vehicle OBDC. In itself it is not uncommon for asset managers to create liquidity for investors in this way. It allows them to create a liquidity event for the investors in private fund and at the same time to keep underlying assets under the umbrella of the management company keeping management fees on those assets. OBDC II is finite life fund, which was obliged to return money to investors at the end of fund life.
The problem was that the OBDC – public vehicle traded at a discount of 10-20% to NAV, so that by accepting the proposed NAV-to-NAV conversion ratio, investors in OBDC II (with higher P/NAV ratio) would immediately face a write down of its investment value to match NAV discount of public vehicle.
It is normal for public vehicles to trade at discount to NAV, in which case asset manager would offer concessions to the investors to make up for the accepted lower valuation (for example by lowering the fees). However this time the discount was particularly large, which investors in OBDC II were unwilling to accept and tried to capture full valuation by redeeming shares before the merger. The company faced a surge in redemption requests and ultimately solved the issue by selling part of the assets from OBDC II to other investors at 99.7% of par value. Subsequently it issued a special 30% pro-rata cash distribution providing liquidity to investors and putting the fund effectively into liquidation, where investors will get the money as the assets are sold (realising the real market NAV in the process).
It is worth to keep two aspect in mind: part of the assets sold from OBDC II were sold to BO owned Kuvare Asset Management, raising questions on related party transactions. The other issue is the quality of the remaining loan book under OBDC II. BO claimed to sell 30% almost at par value. The risk that very often materialises with funds holding illiquid positions (very true for public equity mutual funds as well) is that in times of distress managers sell the most liquid and highest quality positions, simply because it is much easier to sell them, leaving for the investors in the fund the bits that are either sellable only at a discount or unsellable at all. So when big redemptions are expected it is better to be in front of the queue.
Blackstone Private Credit Fund (BCRED) redemptions – BCRED is $82b perpetual non-traded BDC. In 1Q26 it received redemption requests totalling 7.9% of its shares, exceeding the limit of 5% (contagion from Blue Owl OBDC II liquidation). The redemption size is unusual and reflects nervousness among investors around the value of loans made by the fund. In this case rather than prorating the requests to 5.0%, Blackstone utilized a board provision to expand the tender offer limit to 7.0%. To cover the remaining deficit ($400.0 million), Blackstone and its internal employees injected proprietary capital into the fund to buy out the exiting investors.
BlackRock HPS Corporate Lending Fund redemption – it is a $26b fund, which in 1q26 got redemption requests totalling 9.3% of NAV. In this case the manager decided to keep the 5% limit and not satisfy redemptions above that level.
These very recent examples show that the stress level in private credit ecosystem is increasing, investors getting nervous and the structural maturity mismatch between asset life duration and liquidity requirements by retail investors can make serious damage to the system. It will be crucial to see redemption volume in the rest of 2026. As described above the sheer size, $1.8trn, the private credit funds reached in the recent years, make them not only critical funding avenue for private equity, they pose a systemic risk to the whole economy.
Relationship between NAV, BDC share price, BDC capital sourcing and earnings of alternative asset managers – public BDC’s are obliged by SEC to perform quarterly fair value assessment of its assets. In case of illiquid assets, like loans, fair valuation is to a large extent a subjective assessment. Different managers may have different assumptions and tactical reasons when valuing the assets. The result of this valuation is NAV of the fund.
Share price is what the market perceives is the fair value of those assets. Regulations forbid raising capital at valuation below NAV, so in order to raise fresh investments public BDC’s need to trade at or above NAV. In times of stress, like now, public BDC’s trade below, should the situation continue it will limit the ability of managers relying on traded BDC’s to grow AUM, negatively affecting ceteris paribus EPS growth projections.
Credit risk assessment: BDC’s vs commercial banks – BDC’s account for risk in a different way than the commercial banks. For commercial banks the main mechanism is utilisation of Current Expected Credit Losses (CECL), which requires banks to build provision reserves against expected losses of the loan portfolio. The level of provision is based on the statistical models and depends on the macroeconomic assumptions and on specific loan default probability. When macroeconomic situation deteriorates or specific borrower shows sign of distress, banks usually increase provisioning level. Similarly provisions can be decreased if models show that economic situation improves. Decrease or increase in provisioning has a direct impact on EPS of the banks.
BDC’s don’t build provisions but are required to mark their loan portfolio to fair value on the quarterly basis. Potential losses are recognised as “Unrealised depreciation”, which is non-cash cost in the P&L and decrease the NAV.
Credit risk assessment: Non-Accrual rates – The most direct way to assess the quality of the portfolio is to look at the non-accrual rates at amortized cost (non-accrual original loan value / investment portfolio value). It shows the value of the impaired loans relative to the whole portfolio. Think of non-performing loans on the balance of a commercial bank.
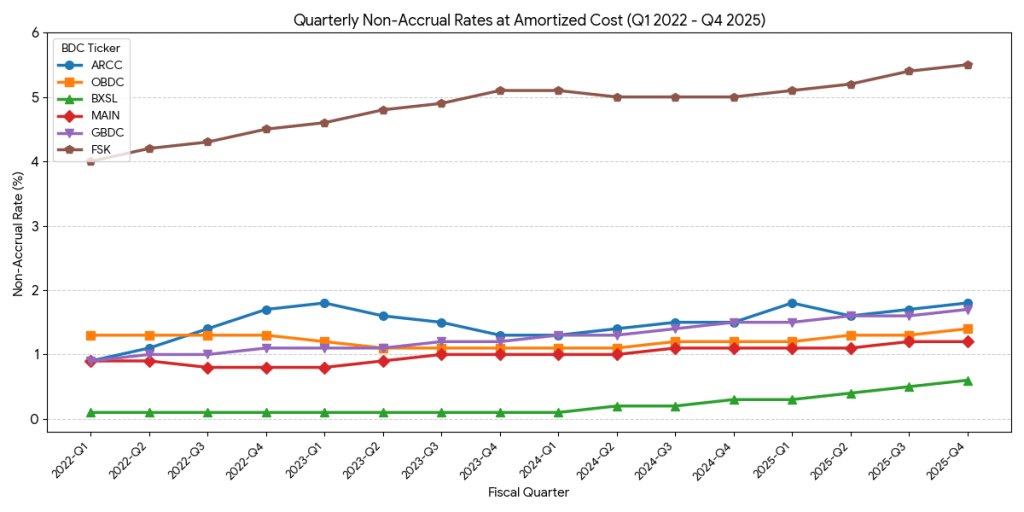
Currently the non-accrual rates are higher than in 2022 and keep rising. The reason for the recent spike is the residual loans from 2020-2021 low interest rate era. In 2023-2024 BDC’s could keep the non-accrual loans steady by restructuring or moving to payment-in-kind interest recognition, however by 2025 these efforts hit natural limitations forcing BDC’s to acknowledge the worst parts of the 2020-2021 vintages as non-accruals.
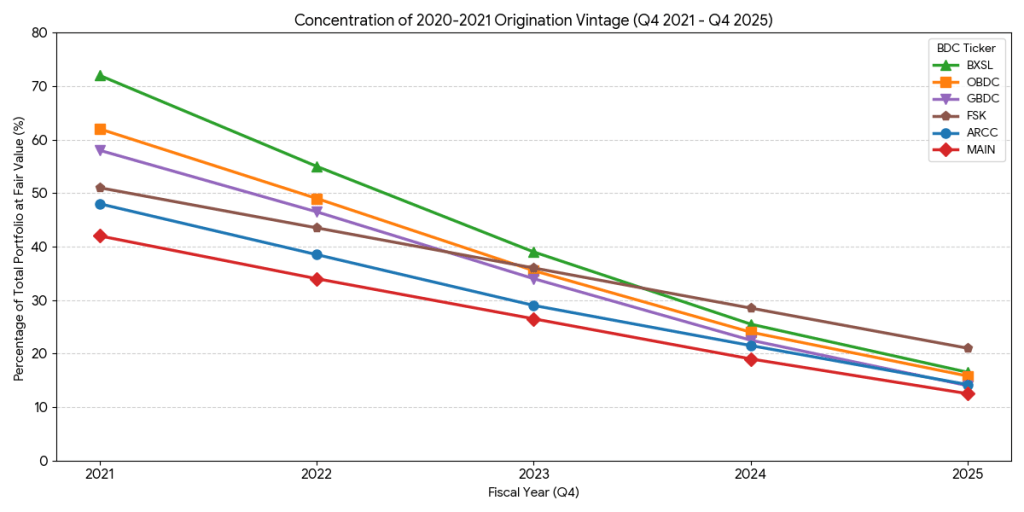
The decline of 2020-2021 vintage in portfolios and replacement by newer vintages, which reflected the new paradigm of high interest rates should naturally lead to reduction of non-accrual loans. However the loans from 2020-2021 that still are on the balance sheets of BDC’s are likely to be of poor quality, as indicated by increasing PIK recognitions and evidence of decrease in interest rate coverage (see below). Contractually the loans generated in 2020-2021 are coming to maturity in 5-7 years, so in 2026 a lot of them will need to be either refinanced or recognised as non performing.
The trouble in the vintages of 2020-2021 are illustrated by spike in interest rates during 2022 and high interest rates since then:
Credit risk assessment: Payment-in-Kind income – Interest recognised as PIK when a BDC stops receiving cash interest payments, but capitalises outstanding interest payments, meaning adding interest to the principal of the loan. It allows BDC to keep a problematic loan from becoming non-accrual. PIK can be useful when lending to businesses with low cash flow conversion, for example tech companies investing all their cash flow in growth now and creating cash flows later. It allows borrowing without immediate cash outflows and for BDCs it allows additional high yielding loan growth. In some cases PIK is a loan restructuring instrument , which allows borrowers to prevent sliding into Chapter 11, saving high administration costs related with it and eventually increasing repayment probability. Sometimes PIK also allows borrowers to bypass covenants on more senior tranches. However, if PIK is used to delay classification of a loan as non-accrual and prevent NAV hit, it becomes problematic for investors, as it tries to hide or delay potential loan write down. PIK is a good leading indicator of the stress level in the BDC loan portfolios. BDC’s are required to reclassify PIK into non-accruals when Valuation Committee decides the reclassification or when Loan-to-Value (LTV) exceeds 100%.
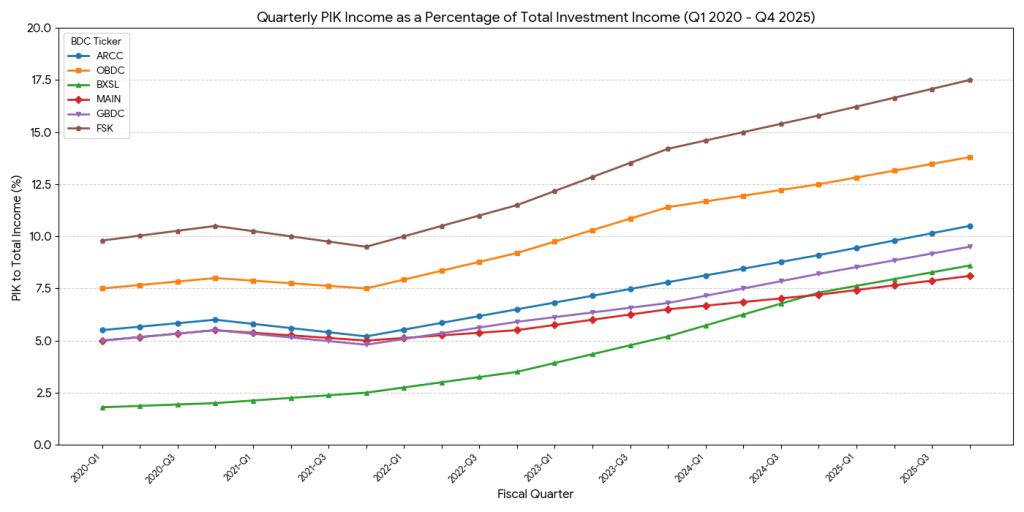
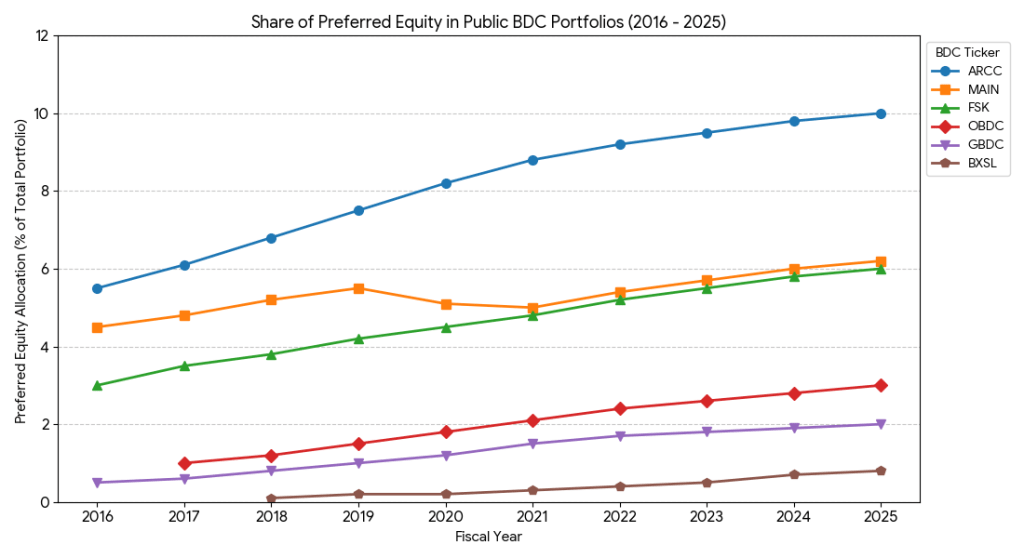
Preferred equity investments distort PIK ratios, as dividends on preferred stock are booked as PIK and do not indicate debt stress level. BDC’s increased preferred equity investments in recent years to improve return profiles for investors or as a restructuring tool to avoid loan write down. It increases risk of the portfolio by introducing equity risk into debt fund and potentially increasing borrowers debt capacity. In addition, preferred stock is usually less liquid and often dependent on equity sponsor liquidity event (exit).
Credit risk assessment: Interest Coverage Ratio – It shows relationship between cash inflow of a borrower and cash outflow as interest for its debt. The higher the ratio, the safer is the borrower. Ratio below 1 indicate that the borrower cannot service interest on its debt.
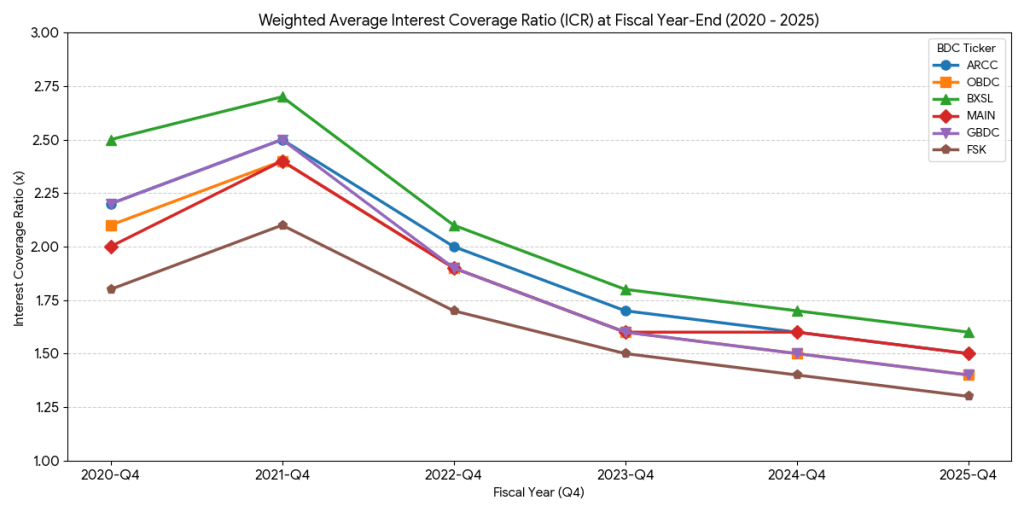
When ICR is below 1, mathematically it means that the borrower cannot service its debt from the current earnings (cash flows). ICR of 1.3 means that 70% of the borrower’s EBITDA (or cash flow) goes to servicing debt, which is not sustainable in the long run without significant increase in EBITDA. Though BDC’s do not report ICR by vintages, given the overall ICR reduction and increase in PIK it is plausible to assume that ICR for 2020-2021 vintages have fallen below 1.3 and probably in some cases approach 1.
PIK and required dividend distribution of minimum 90% of taxable income to retain BDC status – BDCs are obliged to distribute cash dividend of minimum 90% of taxable income to retain status as BDC. PIK loans or preferred equity does not pay cash interest or dividends, though PIK contributions still accounted towards taxable income. If PIK level increases through a certain threshold, BDC would not have enough cash inflow to fund cash dividends to investors at 90% level. That is what currently happens at OBDC and GBDC.
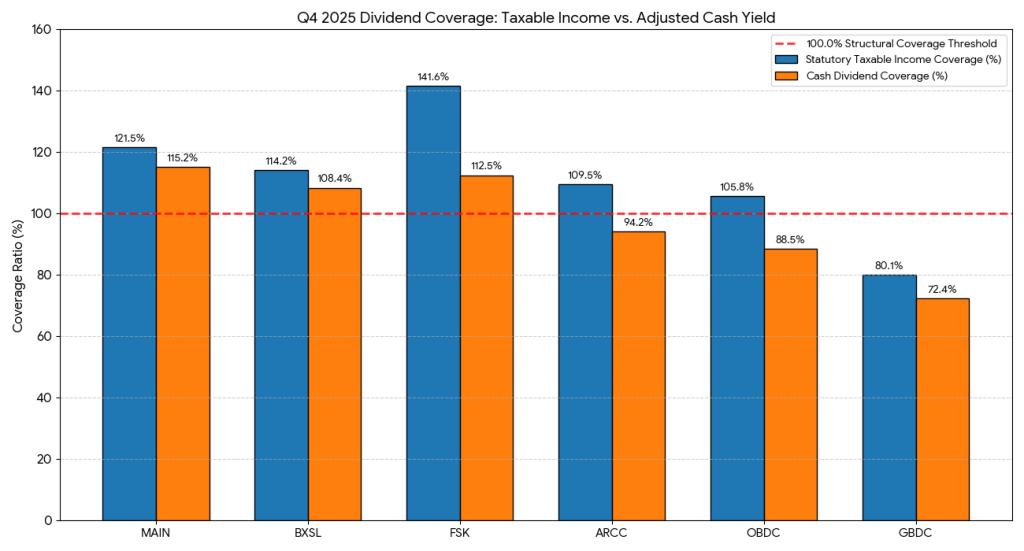
To bridge the the liquidity gap BDC can either raise debt, sell assets or issue, distribute stock as dividend, decrease management fees or write off part of PIK. All these options have drawbacks, but OBDC and GBDC have no other way but to address this problem.
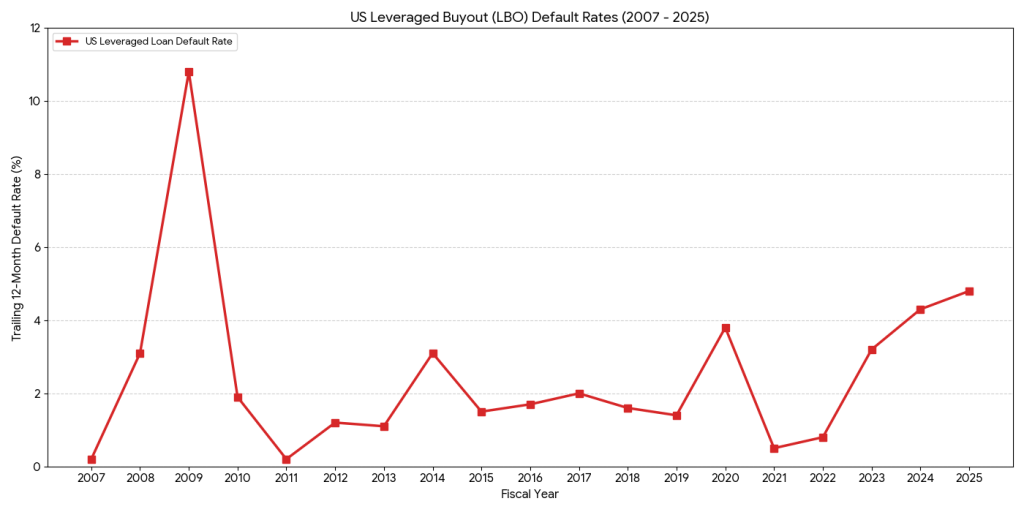
LBO defaults – During the low interest era the defaults were kept at artificially low levels. With the increase in interest rates in 2022 defaults started to creep up and reached highest levels since 2008. For now it is not evident that we have seen the peak in defaults.
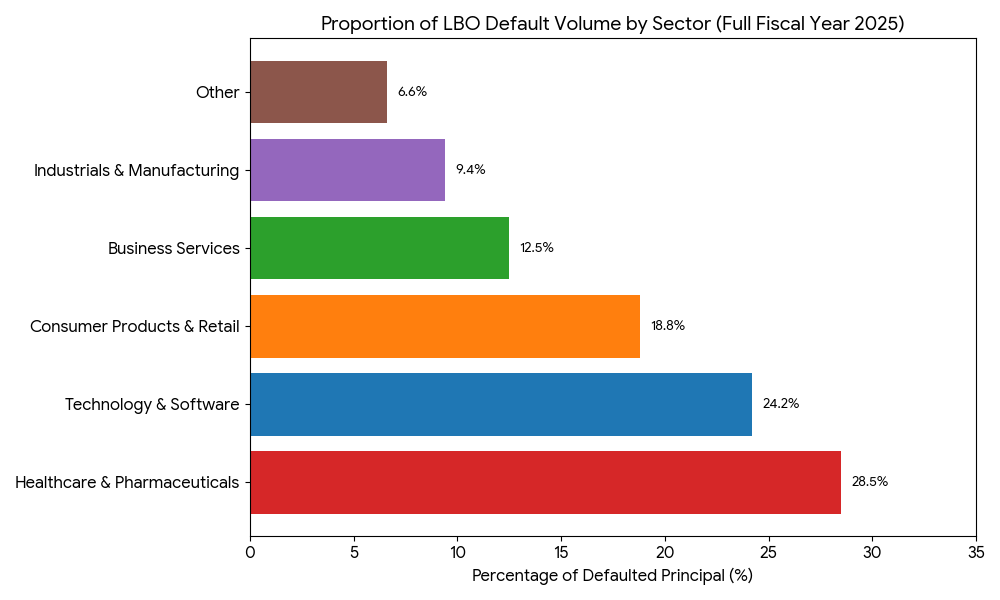
The LBO defaults were concentrated in 3 sectors: Healthcare, Software and Consumer Products.
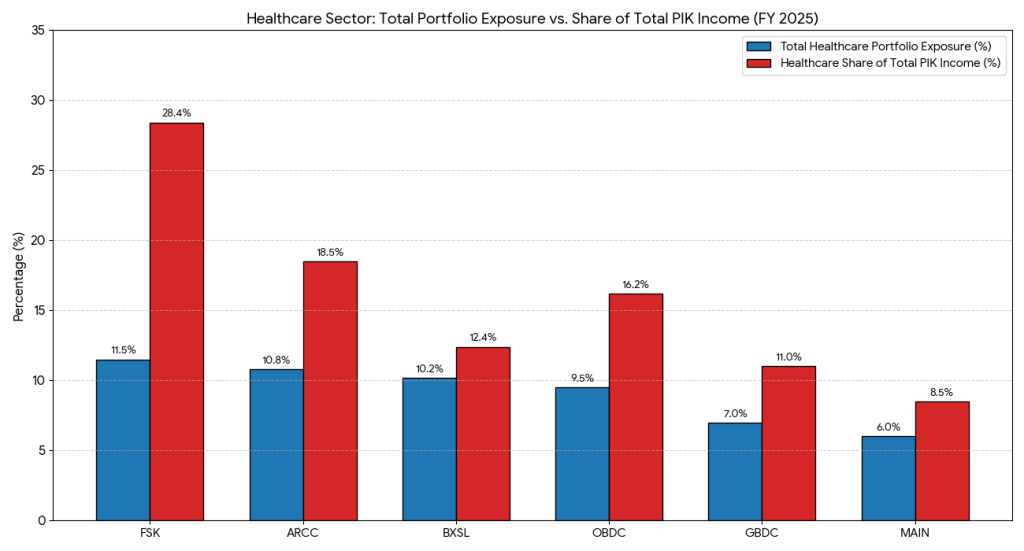
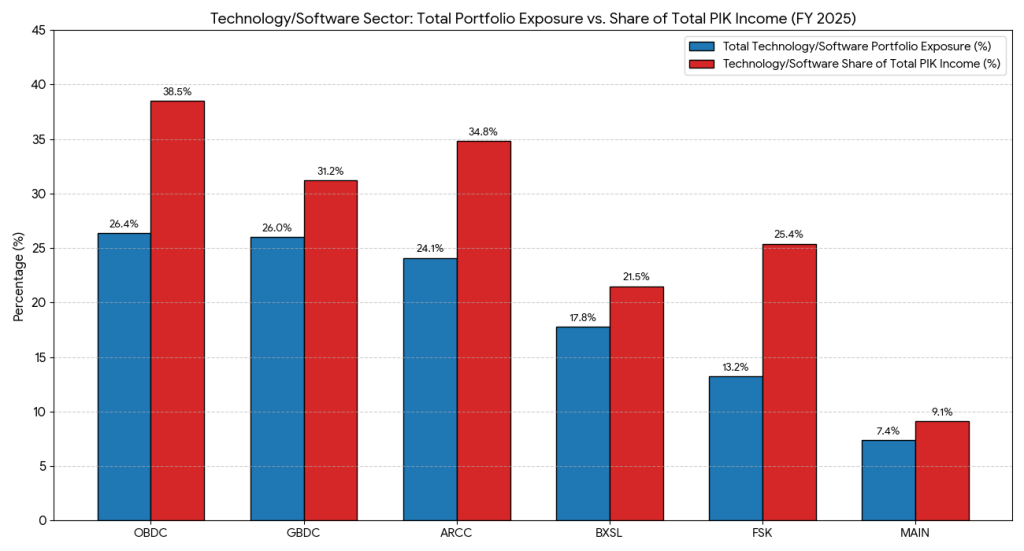
All largest public BDC’s have significant exposure to those three sectors, though to a different extent. The charts below illustrates exposure of the public BDC’s to healthcare and software sectors and share of these sectors in PIK. Large volume in PIK indicates potential unrealised defaults in the portfolio. As we know that both Healthcare and Software sectors face structural difficulties, the likelihood that PIK loans will transform into non-accruals is very significant.
In general public BDC’s are still working through their 2020-2021 vintages. As of 4q25 PIK levels, as a lead indicator was going up QoQ for all public BDC’s. Exposure to troubled sectors is still quite high and ICR’s are coming down. It is unclear how much of the loan book, made during low interest rate era will default, but as of now there is no sign that the defaults have peaked. Earnings in 4q25 have largely disappointed, EPS downgrades followed and share prices corrected quite significantly. Since Decemberof 2025, EPS 2026 consensus went down by 9% and by 17% for 2027. It was reflected in corrections of share prices of BDC’s. MAIN is an outlier for several structural reasons (for example it employs own management team, capturing fee and outperformance income).
Valuation: current P/NAV ratios came down significantly in 2025.
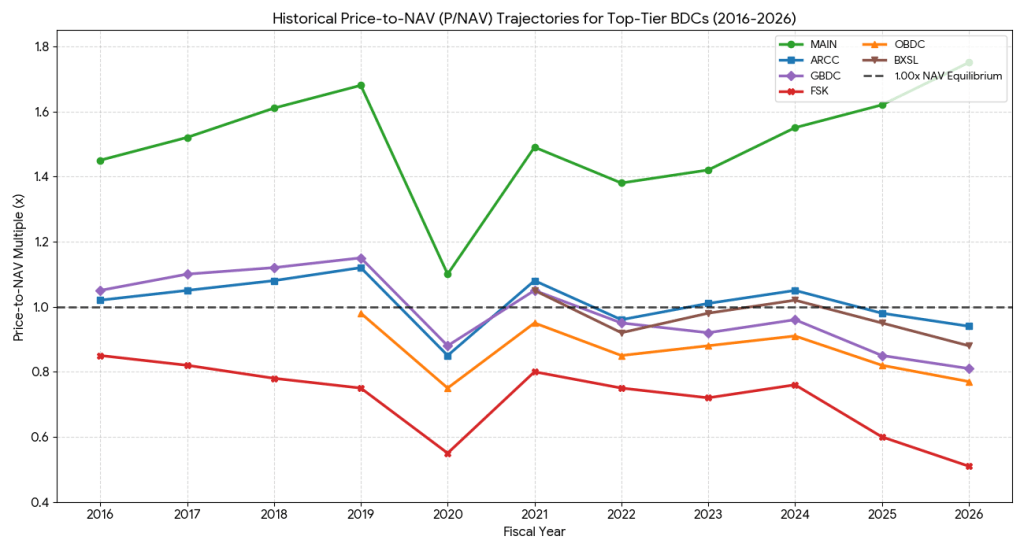
As the chart shows OBDC and FSK are trading continuously at a discount to NAV. It is a structural problem, as they are not allowed to raise new equity money on the primary market and instead are reliant to NAV-to-NAV mergers with other BDC’s or on debt funding (which is capped). So structurally the equity story of a BDC which trades at permanent discount to NAV is seriously flawed, which in itself is a reason for lower valuation multiples. During the Blue Owl IPO the investment narrative was based on the growth of OBDC through the equity issuance, however due to discounts Blue Owl had to pivot to raising capital in the private BDC’s through wealth management channels and merging those private BDC’s with OBDC. However recent revolt of OBDC II investors to the proposal to be merged with highly discounted OBDC show limitations of this strategy and potential structural risk to the Blue Owl business model.
BDC’s navigate currently through rough waters and cyclical downturn. It is too early to consider re-entering the sector as equity investor. It will take some time to deal and work through the loans made during the low interest rate era. 4Q results show that the cycle’s bottom is not reached and further increase in non-accruals and NAV reductions are very likely. The sign of improvement and possible trigger to re-enter the sector as equity investor will come with the peak in PIK and reduction of exposure to 2020-2021 vintages and structurally problematic sectors.
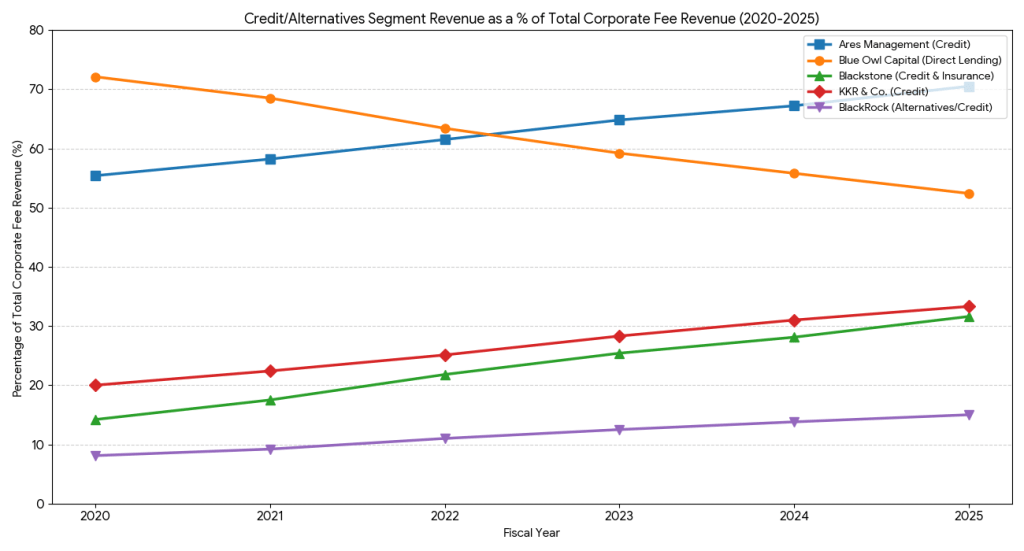
Appendix: How important are BDC’s and alternative credit vehicles for earnings of the parent management companies. Direct lending investment vehicles are main earnings sources for Blue Owl and Ares Management, but even for diversified providers such as Blackstone and KKR, credit investments constitute a third of their fee revenue.
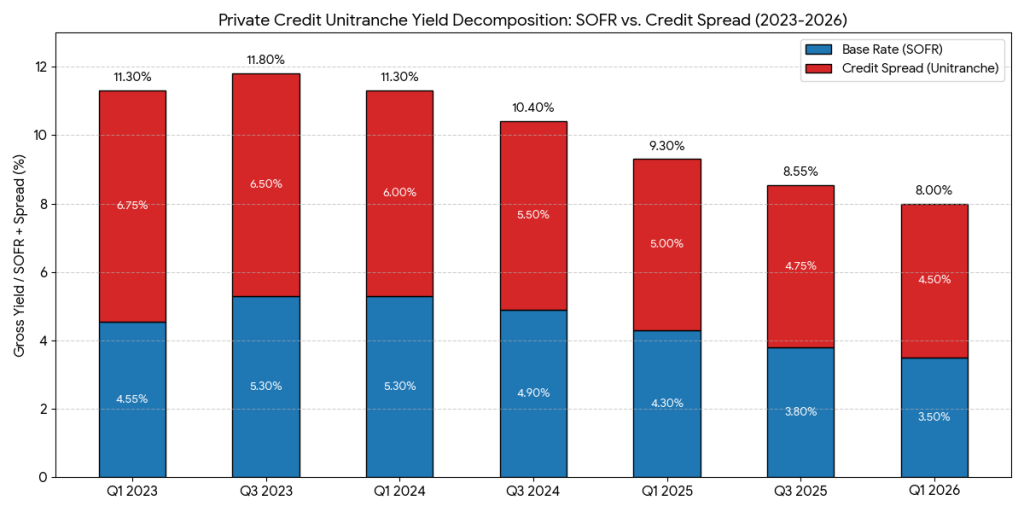
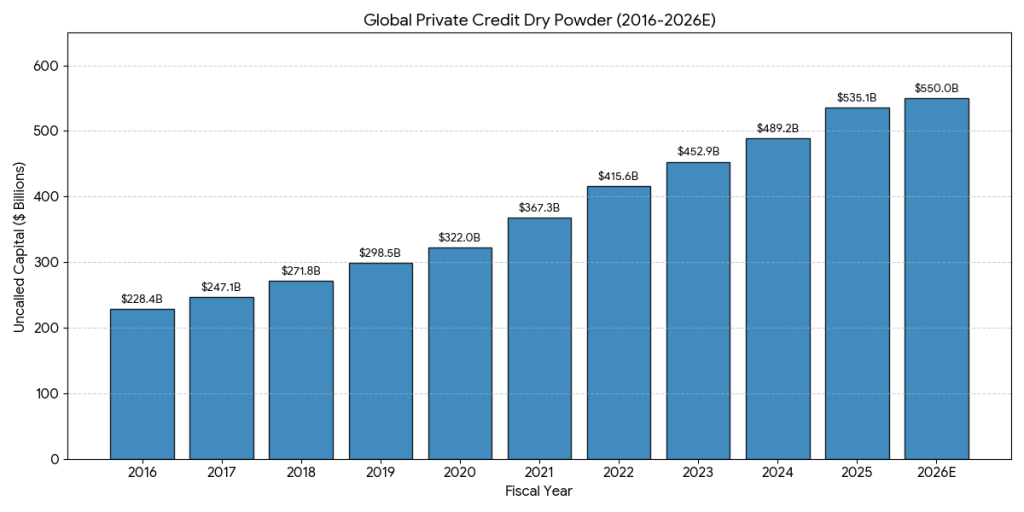
Private credit yield premium and dry powder in the system – private credit yield (measured as premium over SOFR) faces pressure, due to increasing flows into the asset class and limited ability to deploy. It means that the risk for new investors increases not only from lower risk compensation, but also from softer collaterals, higher LTVs, loan syndications and overall increasing pressure to deploy.